SimpleITK and R
22 May 2015Inspired by Marcel Lüthi, I dug into the R-wrapping provided by SimpleITK. Below you find some info about the setup (on my Ubuntu 14.04 machine) and a basic example.
##1. Setting up SimpleITK and installing the R-package
To build SimpleITK is pretty easy, simply follow the instructions here: http://www.itk.org/Wiki/SimpleITK/GettingStarted#R_installation.
##2. Install Fiji (tweaked imageJ)
SimpleITK uses ImageJ to visualize the images but as the vanilla imageJ provided in the Ubuntu repos, does not work, here is a simple workaround:
#get Fiji
wget http://jenkins.imagej.net/job/Stable-Fiji/lastSuccessfulBuild/artifact/fiji-linux64.tar.gz
tar -xzf

#unpack tarball
tar -xvzf fiji-linux64.tar.gz

#copy it to /opt (or any place you like)
sudo cp -r Fiji.app /opt/

#create symlink to /usr/local/bin
sudo ln -s /opt/Fiji.app/ImageJ-linux64 /usr/local/bin/imagej
##3. Use SimpleITK in R
Now we are ready to fire up R and load SimpleITK. The package is pretty cool, as you have access to the entire SimpleITK API and can access the Member functions in R with the ‘$’ Operator (see examples below).
require(SimpleITK)
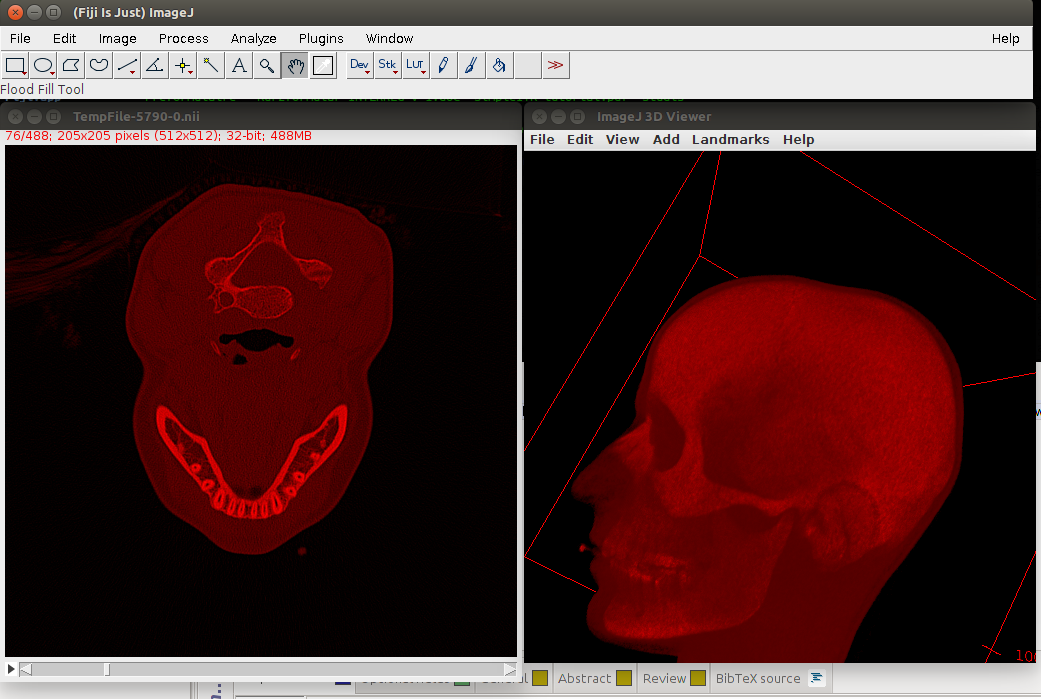
###Load an image Let’s load an image and visualize it:
myimage <- ReadImage("myimage.nii.gz")
myimage #this will call imageJ
The last command (only the name of the image) calls imageJ and Fig. 1 shows how this can look like, when viewed with Fiji’s 3D Viewer.
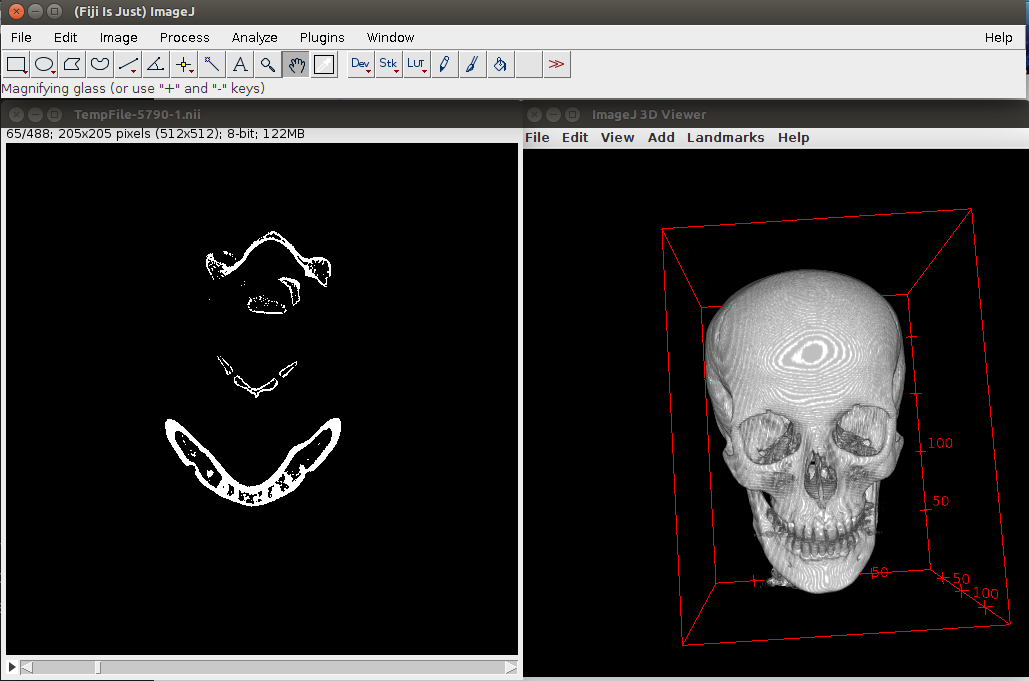
###Do a simple Binary thresholding
##create a filter and set the parameters
tif <- BinaryThresholdImageFilter()
tif$SetInsideValue(255)
tif$SetOutsideValue(0)
tif$SetLowerThreshold(650)
tif$SetUpperThreshold(2500)
timage <- tif$Execute(myimage)
## visualize it
timage

##write the thresholded image to disk
WriteImage(timage, "myimageThresh.nii.gz")
We can view the result of the thresholding in Fig. 2.
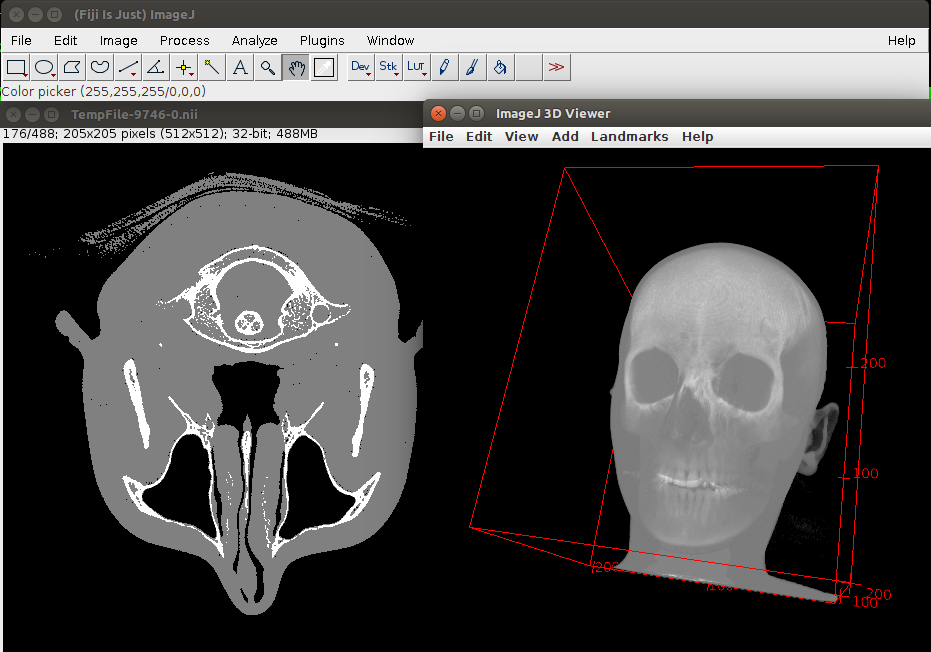
Use R to perform a simple kmeans segmentation (CAVEAT: might need quite some RAM):
##convert image to an R-array
arr <- as.array(myimage) #convert image into array
##run kmean clustering for 3 clusters (background, bone and soft-tissue)
kseg <- kmeans(as.vector(arr),centers = 3)
gc()##free up some memory
## now sort the clusters by original values and
## define a little function to resort the label values
## according to the color values
clustsort <- order(kseg$centers,decreasing = F)
cols <- rep(0L,3)
cols[clustsort] <- 0L:2L  # this means background=0, soft tissue = 1 and bone = 2
refcol <- function(x) {
    x <- cols[x]
    return(x)
}
kseg$cluster <- refcol(kseg$cluster)
arrk <- array(kseg$cluster,dim=dim(arr))
##convert array back to image
imageK <- as.image(arrk,spacing=myimage$GetSpacing(),origin=myimage$GetOrigin())
imageK$SetDirection(myimage$GetDirection())
imageK ##visualize
Now we have 3 labels (Fig. 3):
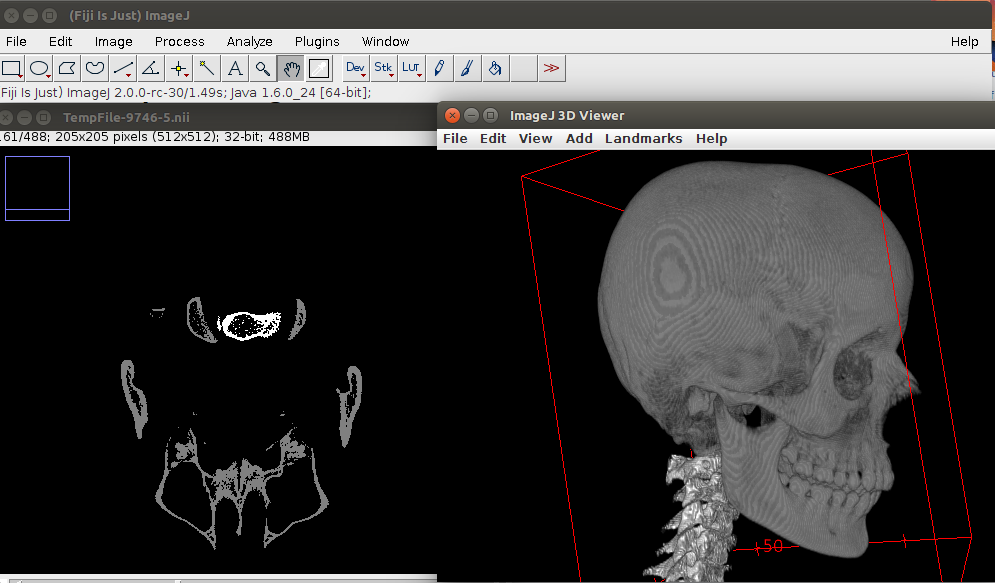
Split the skull into connected components and remove clutter
### Finally, we extract the bone label

tif <- BinaryThresholdImageFilter()
tif$SetInsideValue(255)
tif$SetOutsideValue(0)
tif$SetLowerThreshold(2)
tif$SetUpperThreshold(2)
imageBone <- tif$Execute(imageK)
cc <- ConnectedComponentImageFilter()
cc$FullyConnectedOn()
imageBone <- cc$Execute(imageBone)
relab <- RelabelComponentImageFilter()
relab$SetMinimumObjectSize(5000) ##to remove clutter
imageBone <- relab$Execute(imageBone)
imageBone
Here is the result: Only bone tissue, no clutter and the vertebrae separate from the skull
##Interoperability with ANTsR
As I am also using the extremly nice R-implementation of the ANTs called ANTsR, I wrote two simple functions (called sitk2antsImage and antsImage2sitk)to convert SimpleITK to antsImage and vice versa: https://github.com/zarquon42b/RANTs/blob/master/R/SimpleITK2ANTsR.r.