Improvements in Morpho: Show specific (sets of) slices in deformGrid3d
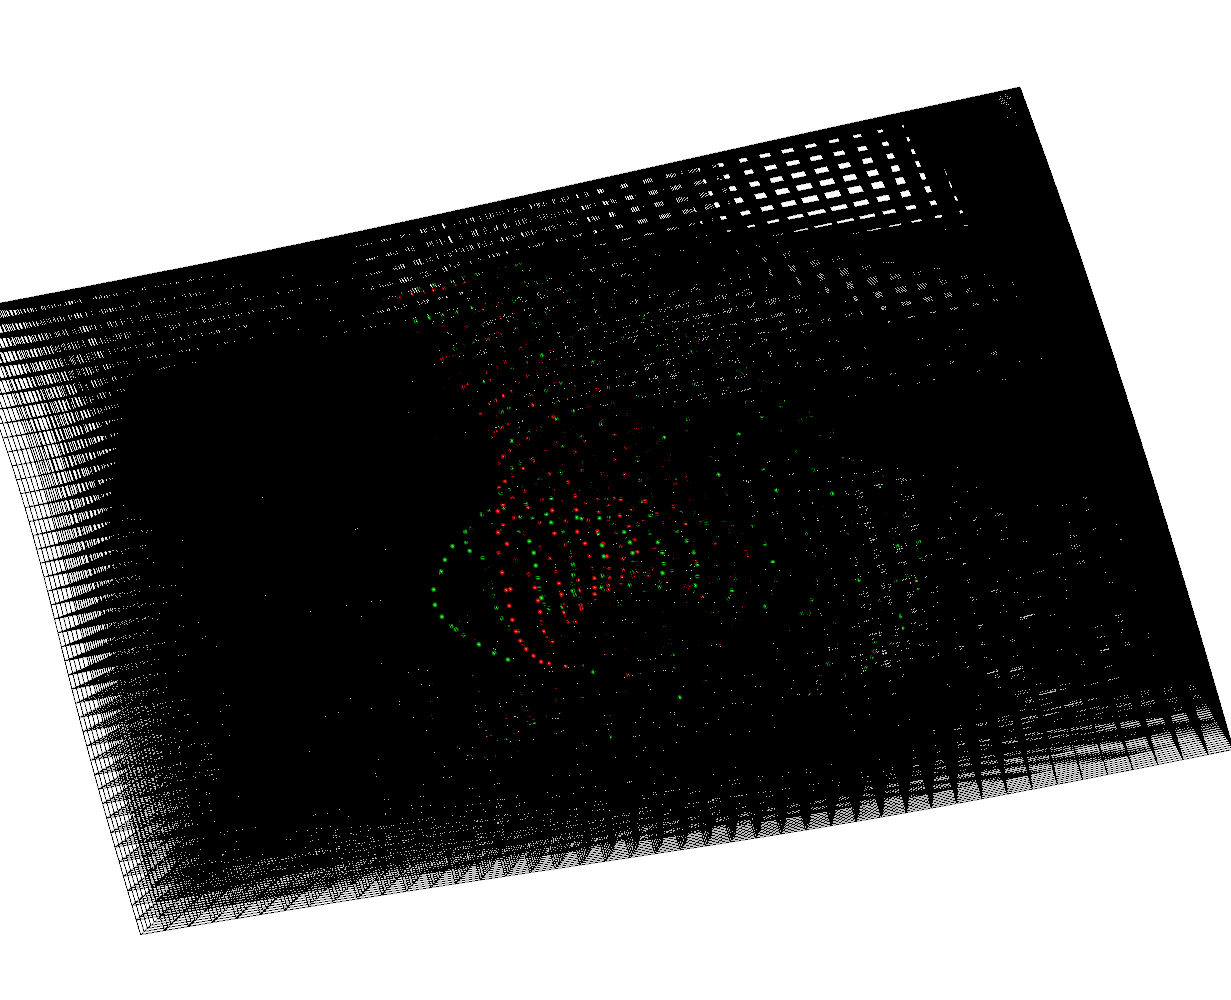
14 Jul 2017In Morpho, deformGrid3d allows to visualize the deformation of the ambient space based on a thin-plate splane deformation calculated from two sets of corresponding coordinates. With a very fine grid, the plot becomes increasingly difficult (Fig. 1 shows a grid with 91,125 control points) to view/interpret. After an email exchange with a user, I added options to select specific (sets) of slices to allow for a better control.
Examples
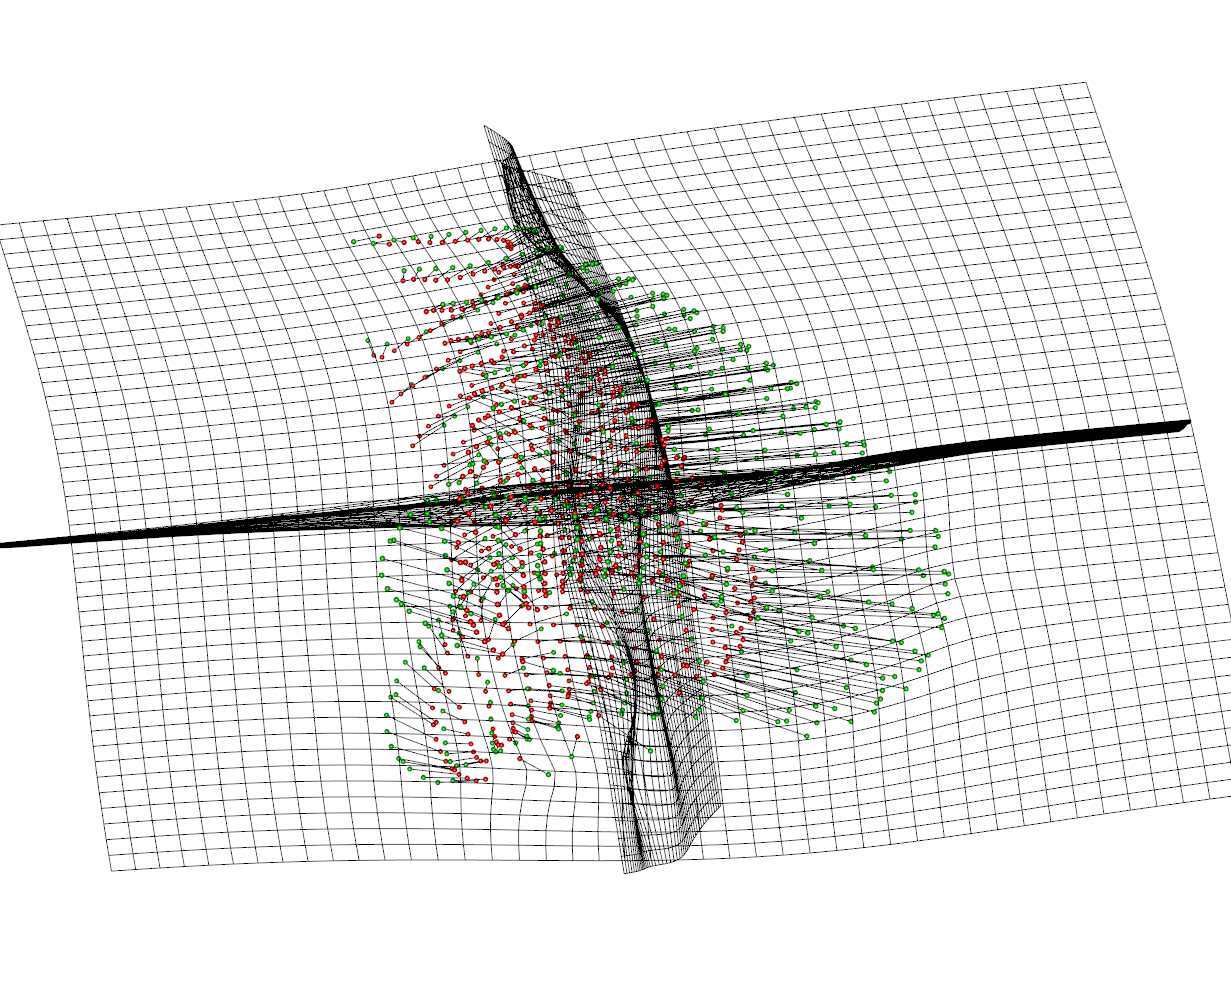
Creating a grid with 45 x 45 x 45 (again 91,125) control points, we now only plot the center layers (23rd). The plot is now much easier to interpret (Fig. 2)
data(nose)
deformGrid3d(shortnose.lm,longnose.lm,showaxis=c(1:3),ngrid=45,slice1=23,slice2=23,slice3=23)
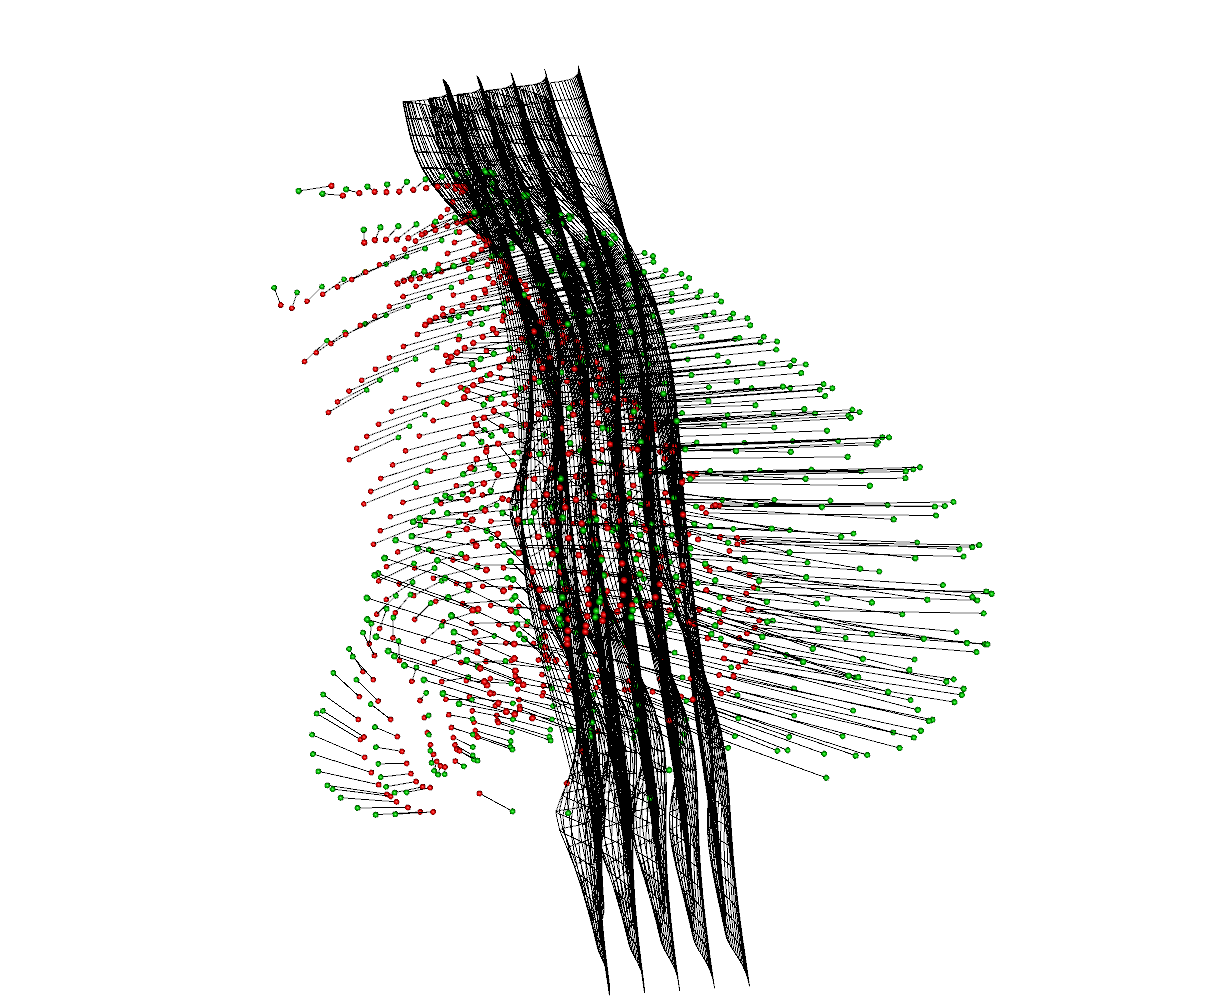
Additionally, we can also select specific sets of slices (Fig. 3).
data(nose)
deformGrid3d(shortnose.lm,longnose.lm,showaxis=2,ngrid=45,slice2=21:25)
And finally, the new options gridcol and gridwidth allow to control the color and linewidth of the grid.